A Faster Way to Monitor Road and Railway Construction with SkyGIS
See how SkyGIS Pro streamlines linear construction monitoring with alignment-based inspection, surface-difference analysis, station volumes, and field-ready reporting.
A More Efficient Workflow for Linear Infrastructure
At SkyGIS, we continuously develop tools that bring practical value to engineers by improving operational efficiency and removing friction from day-to-day workflows.
Monitoring linear infrastructure such as roads and railways is a clear example. These assets are commonly surveyed with conventional topographic methods or remote-sensing techniques including UAV photogrammetry and LiDAR scanning. Traditional survey data, often processed in CAD environments, provides a dependable baseline for validating progress, but collecting and reviewing it can be labour-intensive and spatially limited. UAVs and laser scanners capture rich datasets, yet verifying and manipulating large point clouds from active sites can still require substantial manual work.
SkyGIS Pro provides a dedicated toolkit for linear projects, reducing processing overhead and simplifying routine construction monitoring.
What You Need to Get Started
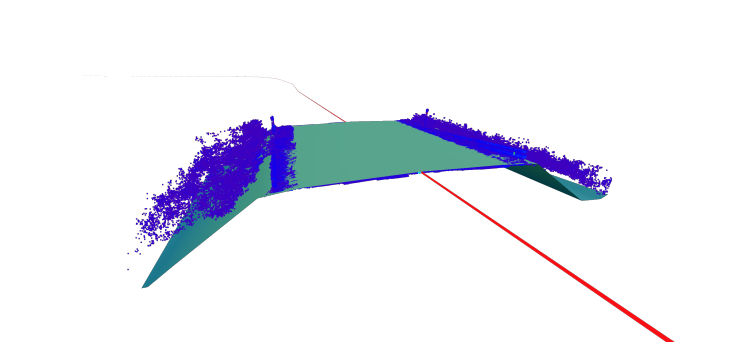
Progress monitoring begins with accurate baseline design data. SkyGIS supports IFC and LandXML formats, as well as CAD files containing a Triangulated Irregular Network (TIN) surface. Because this workflow is designed for linear infrastructure, the project alignment or centreline is essential.
Alignment data can be embedded in a LandXML file or imported separately in standard CAD or GIS formats. If no alignment file is available, it can be digitised directly over the point cloud in SkyGIS. For the best spatial accuracy, use the alignment supplied with the primary design deliverables whenever possible.
Create a project, set the Coordinate Reference System (CRS), and upload the design and spatial datasets with the appropriate processing settings. When importing point clouds, raster rendering is recommended for strong map performance and visual quality.
Establish the Alignment
Once datasets are loaded, SkyGIS either reads the alignment from the LandXML file or lets the user select it in the viewer. Set the active project alignment by specifying its label and starting chainage or section number. Subsequent spatial analysis and progress tracking are then evaluated against this reference line.
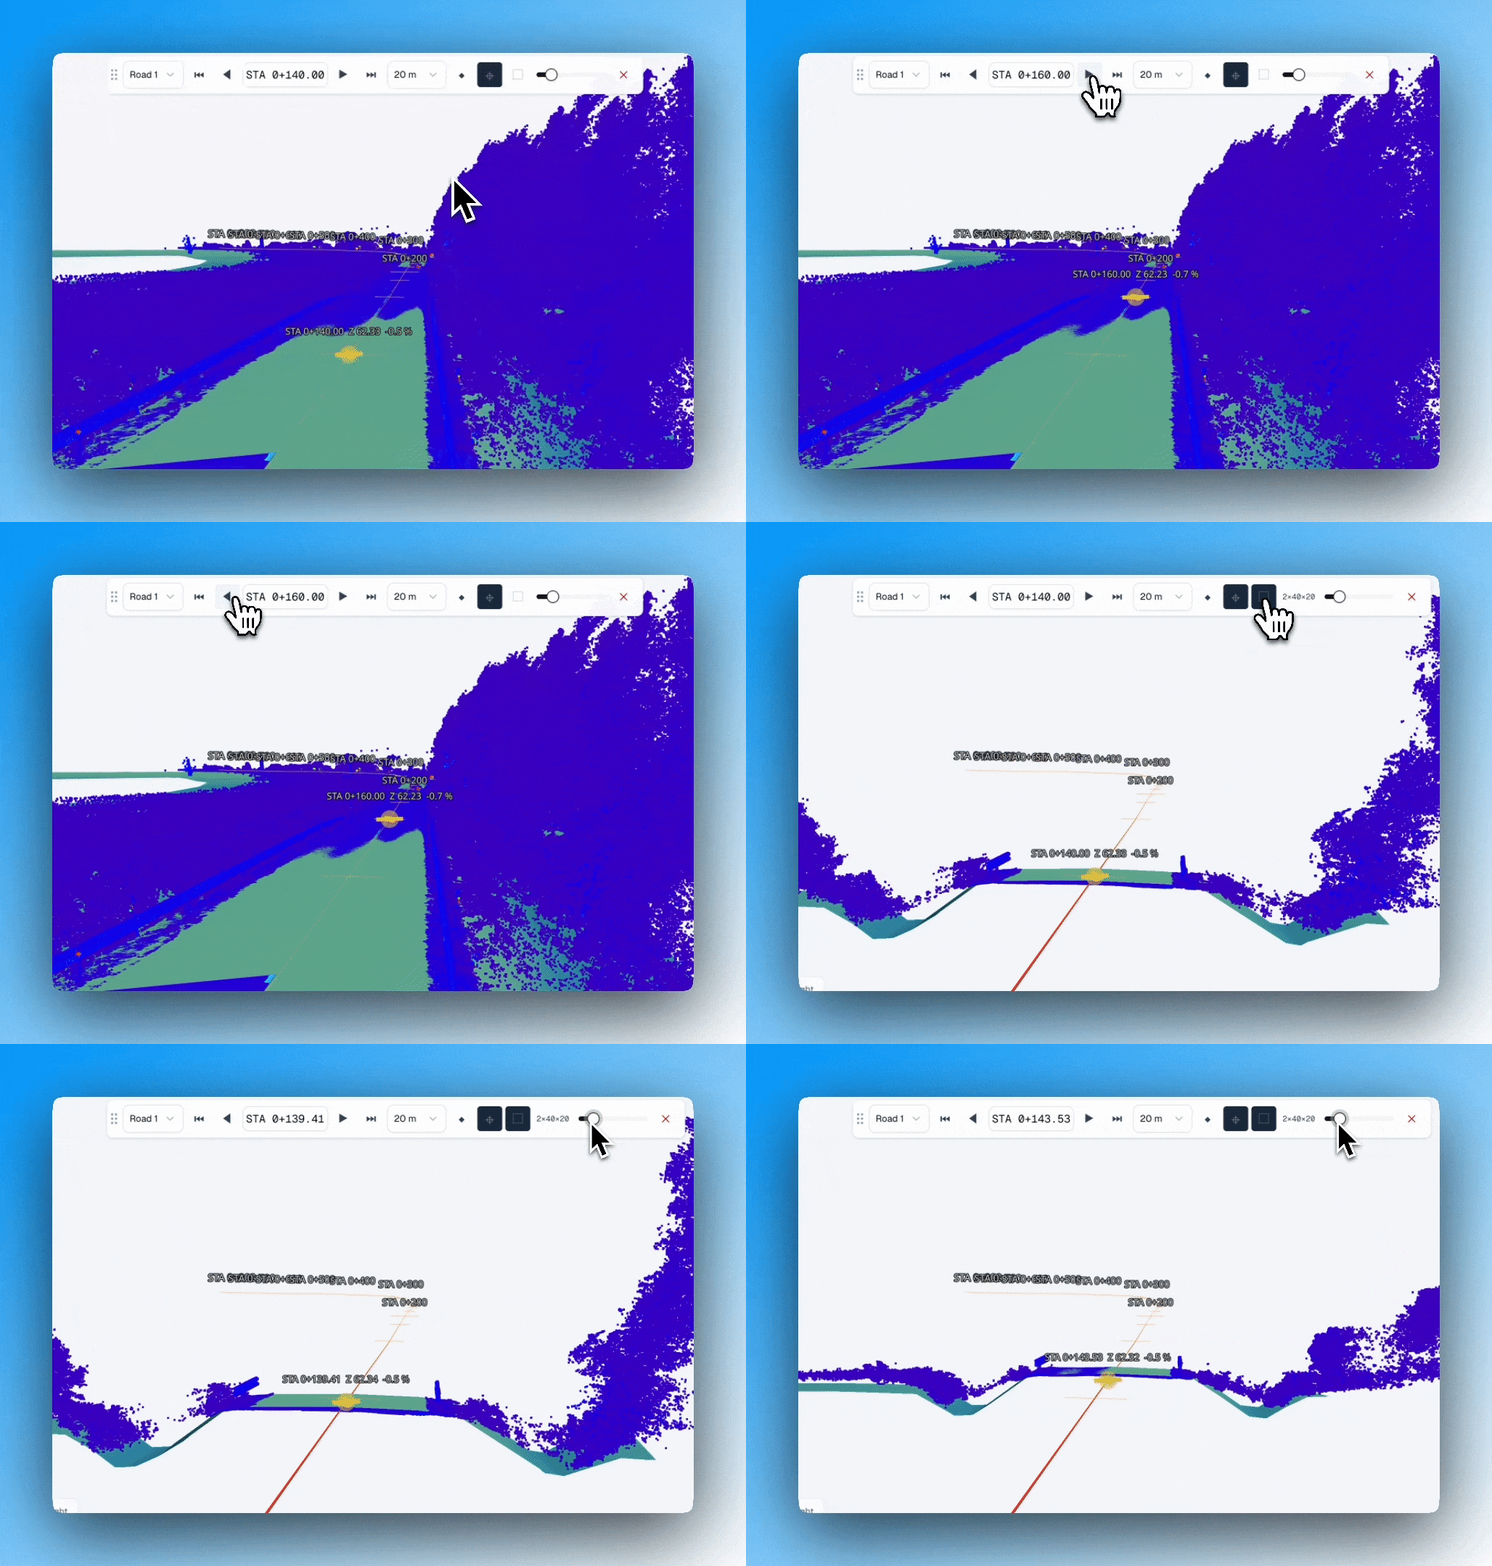
The Walk Alignment tool takes users to individual chainages, queries exact point elevations, and applies a clipping box to isolate matching sections of the point cloud and LandXML model. This gives teams a precise way to assess differences between as-built conditions and the design.
Compare Surfaces and Quantities
Visual inspection provides essential context, but multi-stage construction needs quantitative comparison across evolving IFC layers, CAD surfaces, LandXML files, and sequential point clouds.
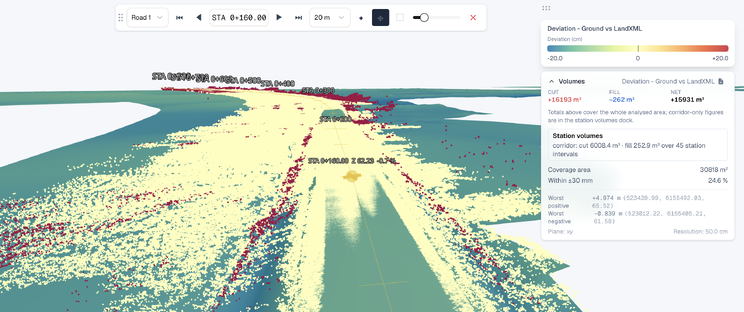
SkyGIS Pro's Surface Difference Analysis supports LandXML-to-LandXML, LandXML-to-point-cloud, and point-cloud-to-point-cloud comparisons. Cut-and-fill volumes can be calculated in all three workflows. A dedicated 3D difference model showing geometric variation is available for LandXML-to-LandXML comparison.
Calculations can cover the full project footprint or a focused boundary imported from another file or digitised with the built-in drawing tools. This isolates individual work zones while retaining the relevant IFC or LandXML layers. When design data is supplied only as an IFC model, SkyGIS can extract its surfaces to LandXML for internal analysis, CAD workflows, or machine-control positioning systems.
Analyse Every Station Along the Route
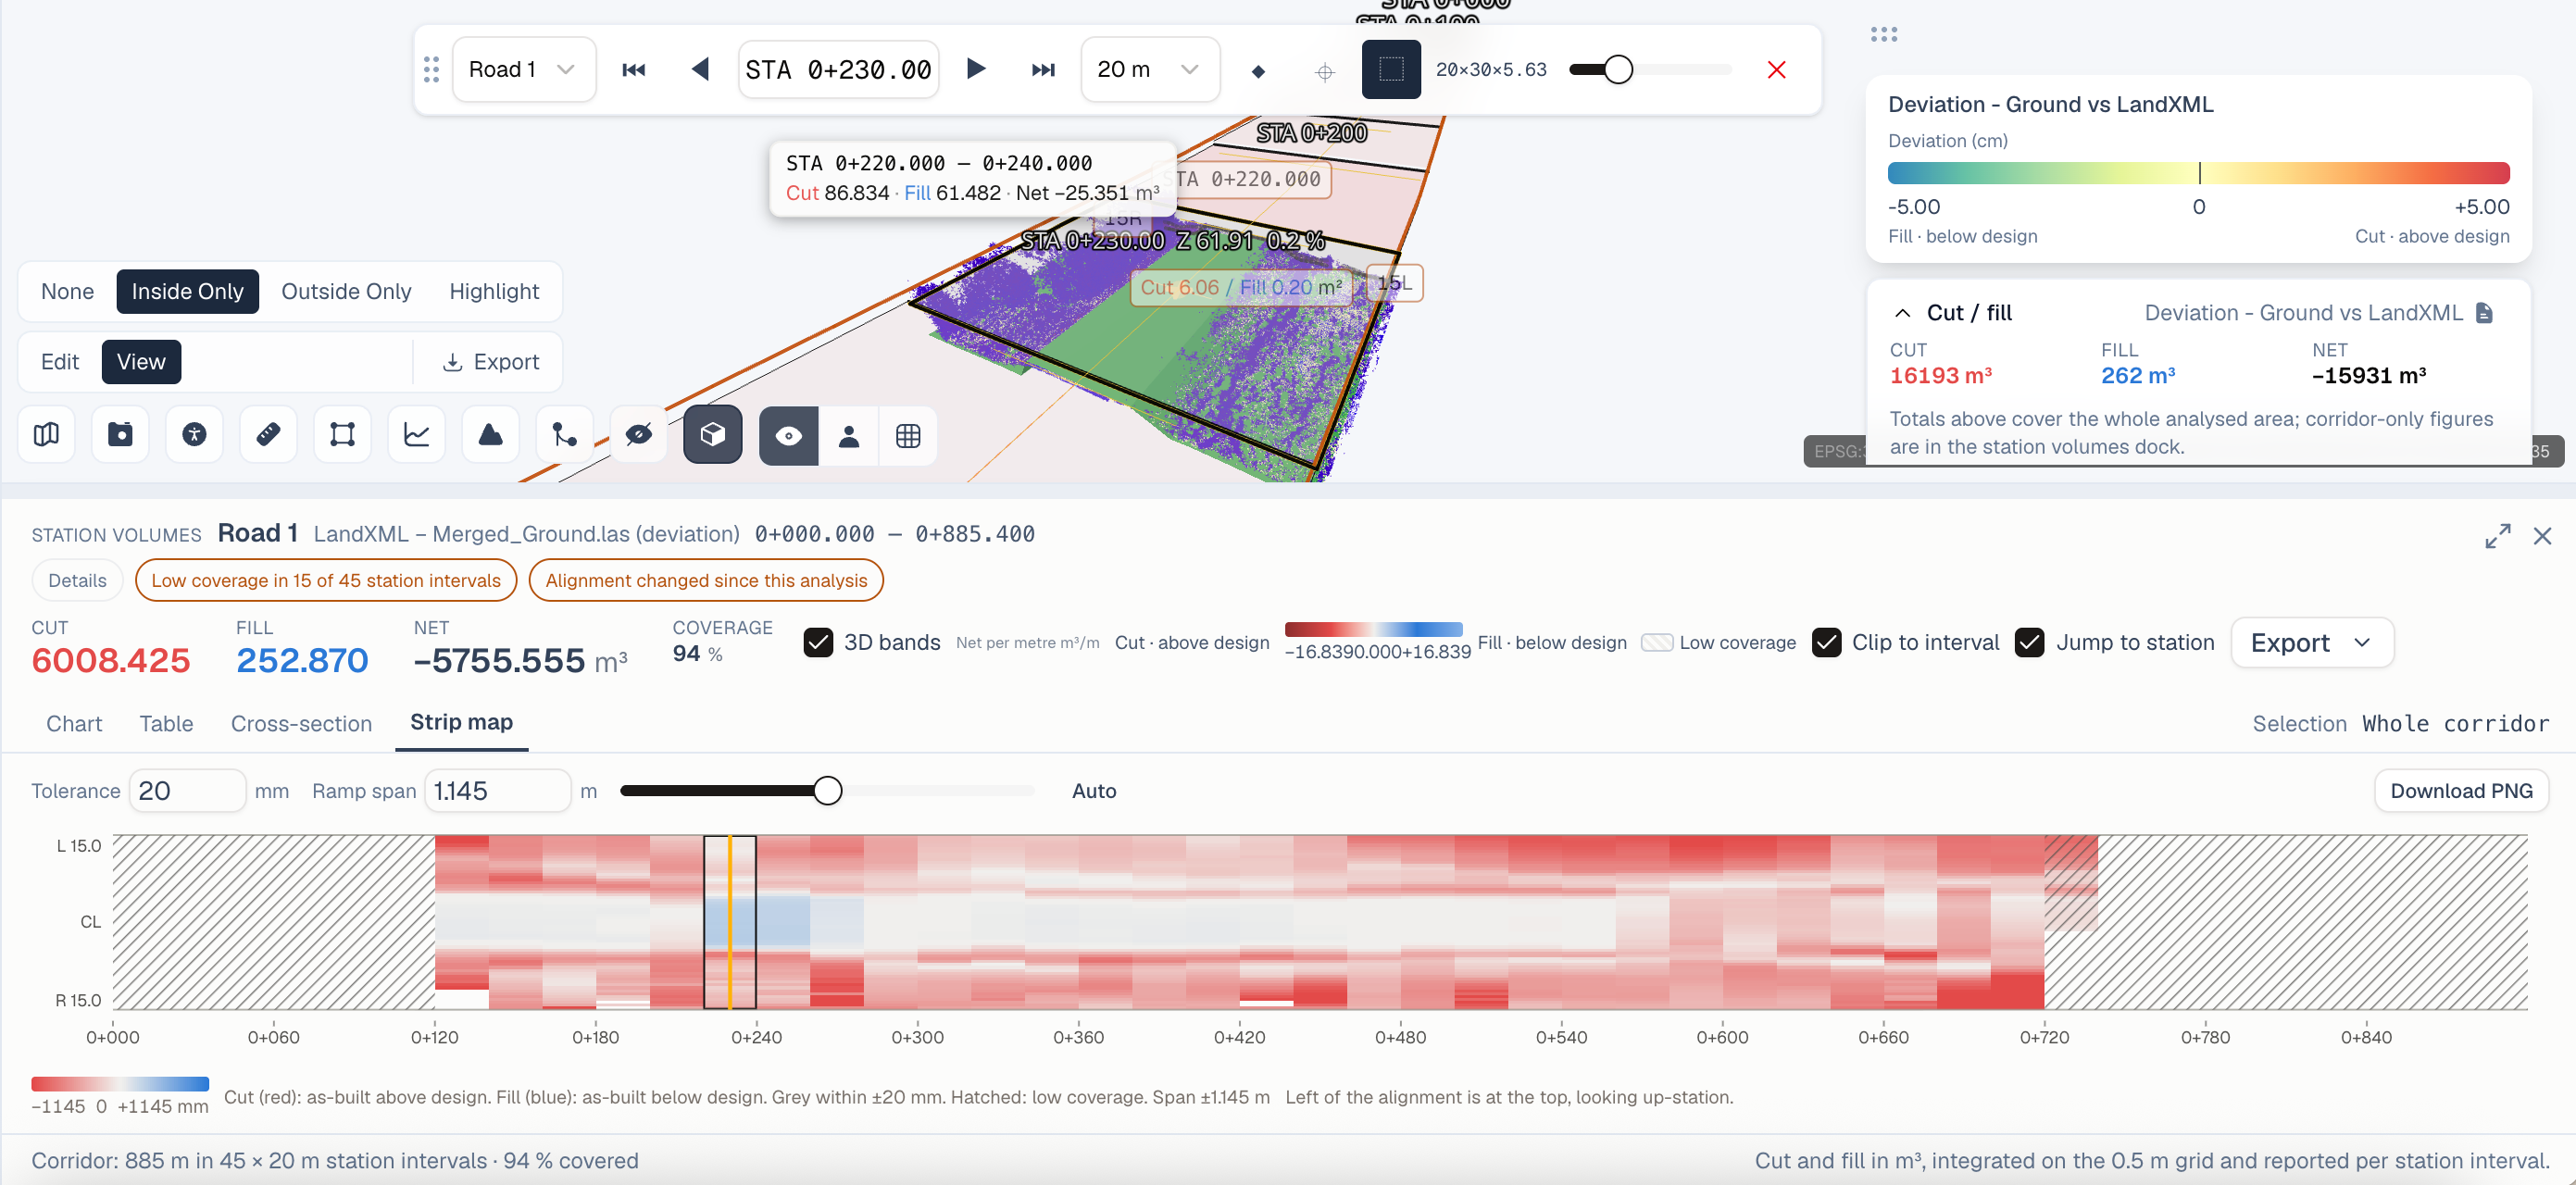
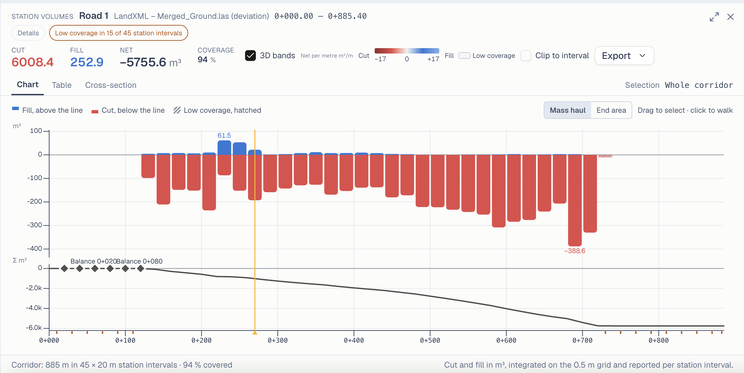
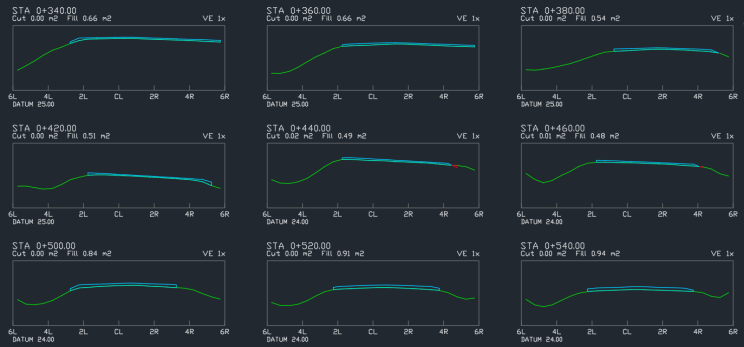
Cumulative cut-and-fill values are useful, but operational decisions often require a more granular view. Users can choose an interval and generate cross-sections along the alignment, dividing the route into discrete Stations. SkyGIS calculates independent cut-and-fill volumes for every station and extracts their cross-sectional geometry.
An interactive column chart displays station-by-station cut-and-fill values, chainages, and cumulative totals. It automatically highlights peak values and areas where survey coverage does not reach the design extent. Selecting a station synchronises the 3D viewer to that location and clips the display to the selected boundaries.
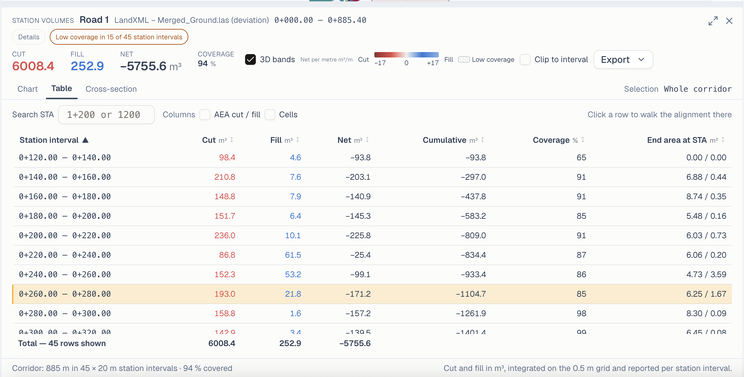
Teams can also work from an interactive table, sorting columns to review cumulative metrics and selecting a row to navigate to the corresponding location. The complete station dataset exports directly to CSV for reporting or further processing.
Put Results in Context in the Field
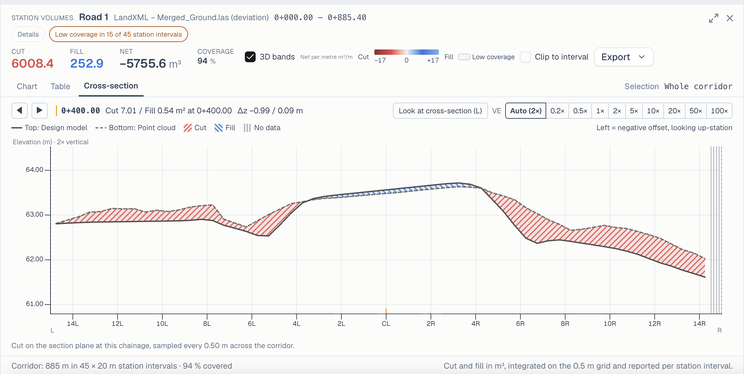
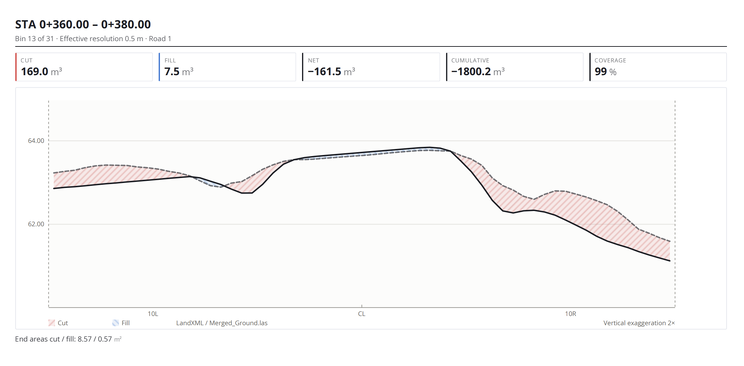
Individual cross-sections can be reviewed in the profile viewer, where colour-coded cut-and-fill areas give site personnel clear spatial context for earthworks and operational adjustments.
SkyGIS works on mobile devices including tablets, and supports pre-caching for reliable use where connectivity is limited. The platform can generate PDF reports and DXF exports for traditional paper deliverables and external CAD applications. PDF reports consolidate key metrics, while DXF exports provide cross-sectional profiles and 3D surface models for downstream design workflows.
Maintain a Complete Progress Record
Run surface-difference calculations for each sequential dataset delivery and organise outputs in date-stamped folders to preserve a clear record of every construction phase. Orthophotomaps, total-station survey points, WMS layers, and GIS vector data can be overlaid with comparison models, giving project managers and decision-makers one consolidated view of progress.
SkyGIS Pro helps teams monitor linear construction faster, analyse site conditions with confidence, and share actionable data across departments. Contact the SkyGIS team to request a technical demonstration or evaluate these workflows in your organisation.