Design vs As-Built: A Practical Guide to Surface Deviation Analysis
Learn how point cloud workflows improve surface deviation analysis, from traditional survey checks to SkyGIS Viewer collaboration and SkyGIS Pro reporting.
Why Deviation Analysis Matters
Understanding the differences between design and as-built conditions is essential in modern construction projects. Accurate deviation analysis supports quality control, enables timely decision-making, and provides valuable insight into construction progress.
Traditionally, these comparisons have relied on discrete measurements collected using conventional surveying instruments. As projects become more complex and digital workflows continue to evolve, point cloud technology and digital twins are changing how survey data is captured, analysed, and shared.
In this article, we explore the evolution of surface deviation analysis, from traditional surveying methods to modern point cloud-based workflows, and show how results can be visualised in SkyGIS Viewer and analysed in greater detail with SkyGIS Pro.
The Classic Method: Surveying Points
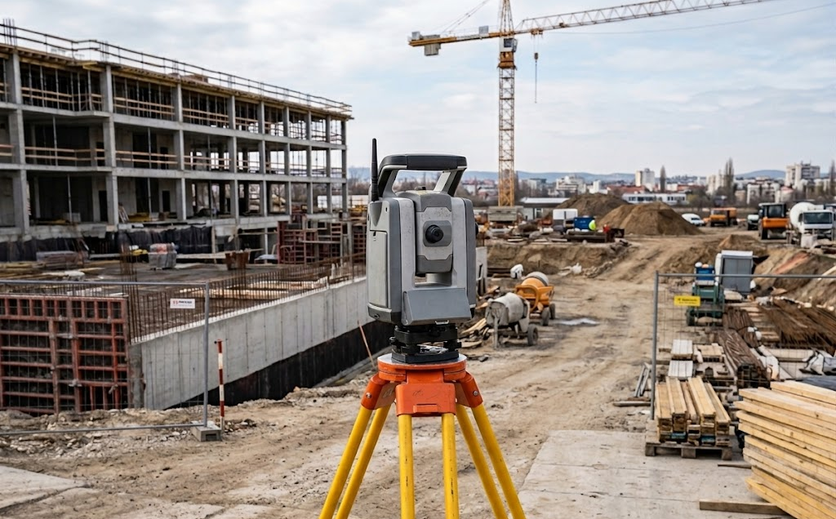
For decades, construction verification has relied on conventional surveying methods. Whether monitoring horizontal surfaces such as roads and pavements or vertical structures such as walls and facades, surveyors typically use total stations to capture predefined grids and critical control points.
In road construction projects, measurements commonly include kerbs, road edges, street furniture, retaining structures, fences, and selected grid points. For buildings and other structures, surveyors often focus on wall surfaces, corners, edges, and other geometrically significant features.
These discrete measurements can be used to create a digital representation of the as-built condition, which can then be compared with the design model to identify deviations or support design adjustments.
The resulting analysis provides valuable information for quality assurance, allowing contractors and engineers to identify discrepancies and implement corrective actions where required. Depending on the project, surveys may be performed as a one-off verification or repeated throughout construction to monitor progress and detect change over time.
Traditionally, final deliverables are provided as CAD drawings or PDF reports, presenting measured deviations in a format that engineers and construction teams can review.
While this approach remains widely used and reliable, it is inherently limited by the number of points that can be practically measured in the field. As project complexity and data requirements increase, alternative methods of data capture become increasingly valuable.
From Discrete Points to Laser Scanning
Modern construction projects demand faster data acquisition, higher levels of detail, and more flexible analysis workflows. As a result, laser scanning has become an increasingly important technology for capturing the built environment.
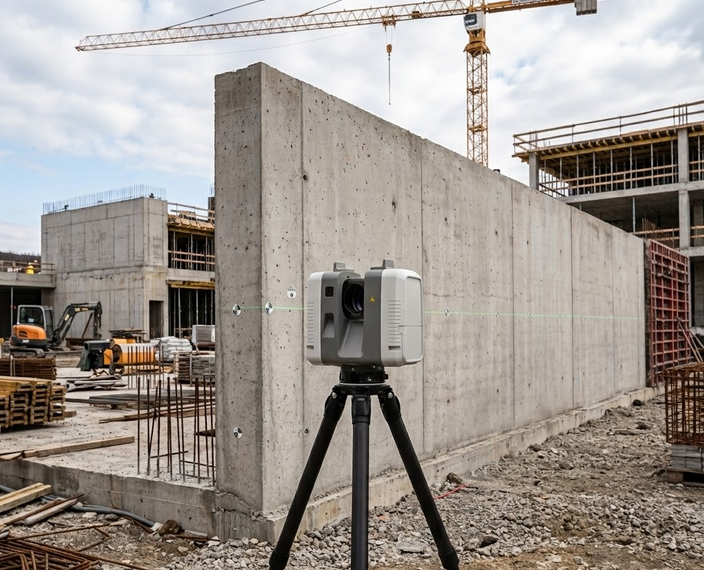
Unlike conventional surveying methods, which rely on selected points, laser scanning captures millions of points to create a comprehensive digital representation of the site. This allows surveyors to bring the site into the office, where measurements and analysis can be performed directly on the captured point cloud.
Point clouds provide far greater flexibility when reconstructing and analysing as-built surfaces. From a single dataset, surveyors can extract grids, breaklines, and critical features manually, semi-automatically, or automatically using specialised software.
These extracted elements can then be used to generate as-built surfaces and compare them against design models, revealing deviations across an entire area instead of only at selected measurement locations.
Laser scanning also expands the range of possible deliverables. Beyond traditional CAD outputs, deviation analysis can be represented as deviation point clouds, raster deviation maps, heat maps, and other high-density visualisations. These formats provide a more intuitive understanding of surface variation and help project teams quickly identify areas requiring attention.
Bringing Construction Data Together with SkyGIS Viewer
Survey projects often generate a wide range of data products, including CAD drawings, contour lines, TINs, LandXML files, digital terrain models (DTMs), 3D models, point clouds, and panoramic imagery.
Although these datasets are valuable individually, managing multiple formats across different software platforms can create challenges for project teams. During active construction phases, it is especially important that every stakeholder has access to the latest information.
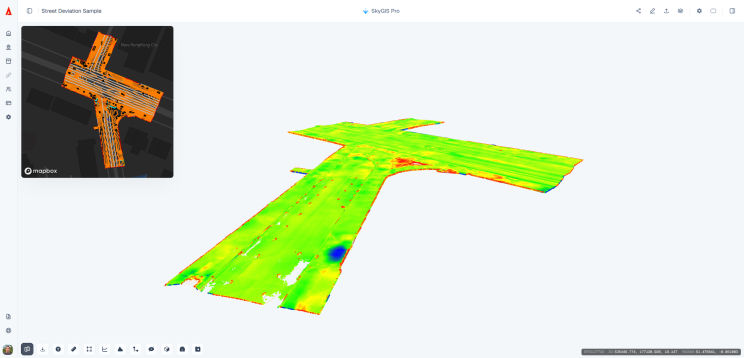
SkyGIS Viewer addresses this challenge by bringing different geospatial datasets together within a single web-based environment. Point clouds, laser scanning imagery, CAD drawings, LandXML files, and 3D models can be visualised together, regardless of their original format.
Users can explore the project in 3D, inspect individual elements, and better understand the relationship between the design and the current as-built condition.
Optimised for tablet devices, SkyGIS Viewer is particularly suitable for on-site inspections. Engineers and construction teams can access project information directly in the field without requiring specialised desktop software. Data can also be shared through a single web link, helping stakeholders work from consistent, up-to-date information.
For long-term monitoring projects, multiple survey campaigns and construction stages can be maintained within the same project environment. Historical and current datasets remain available for comparison, allowing teams to track progress and identify changes throughout the project lifecycle.
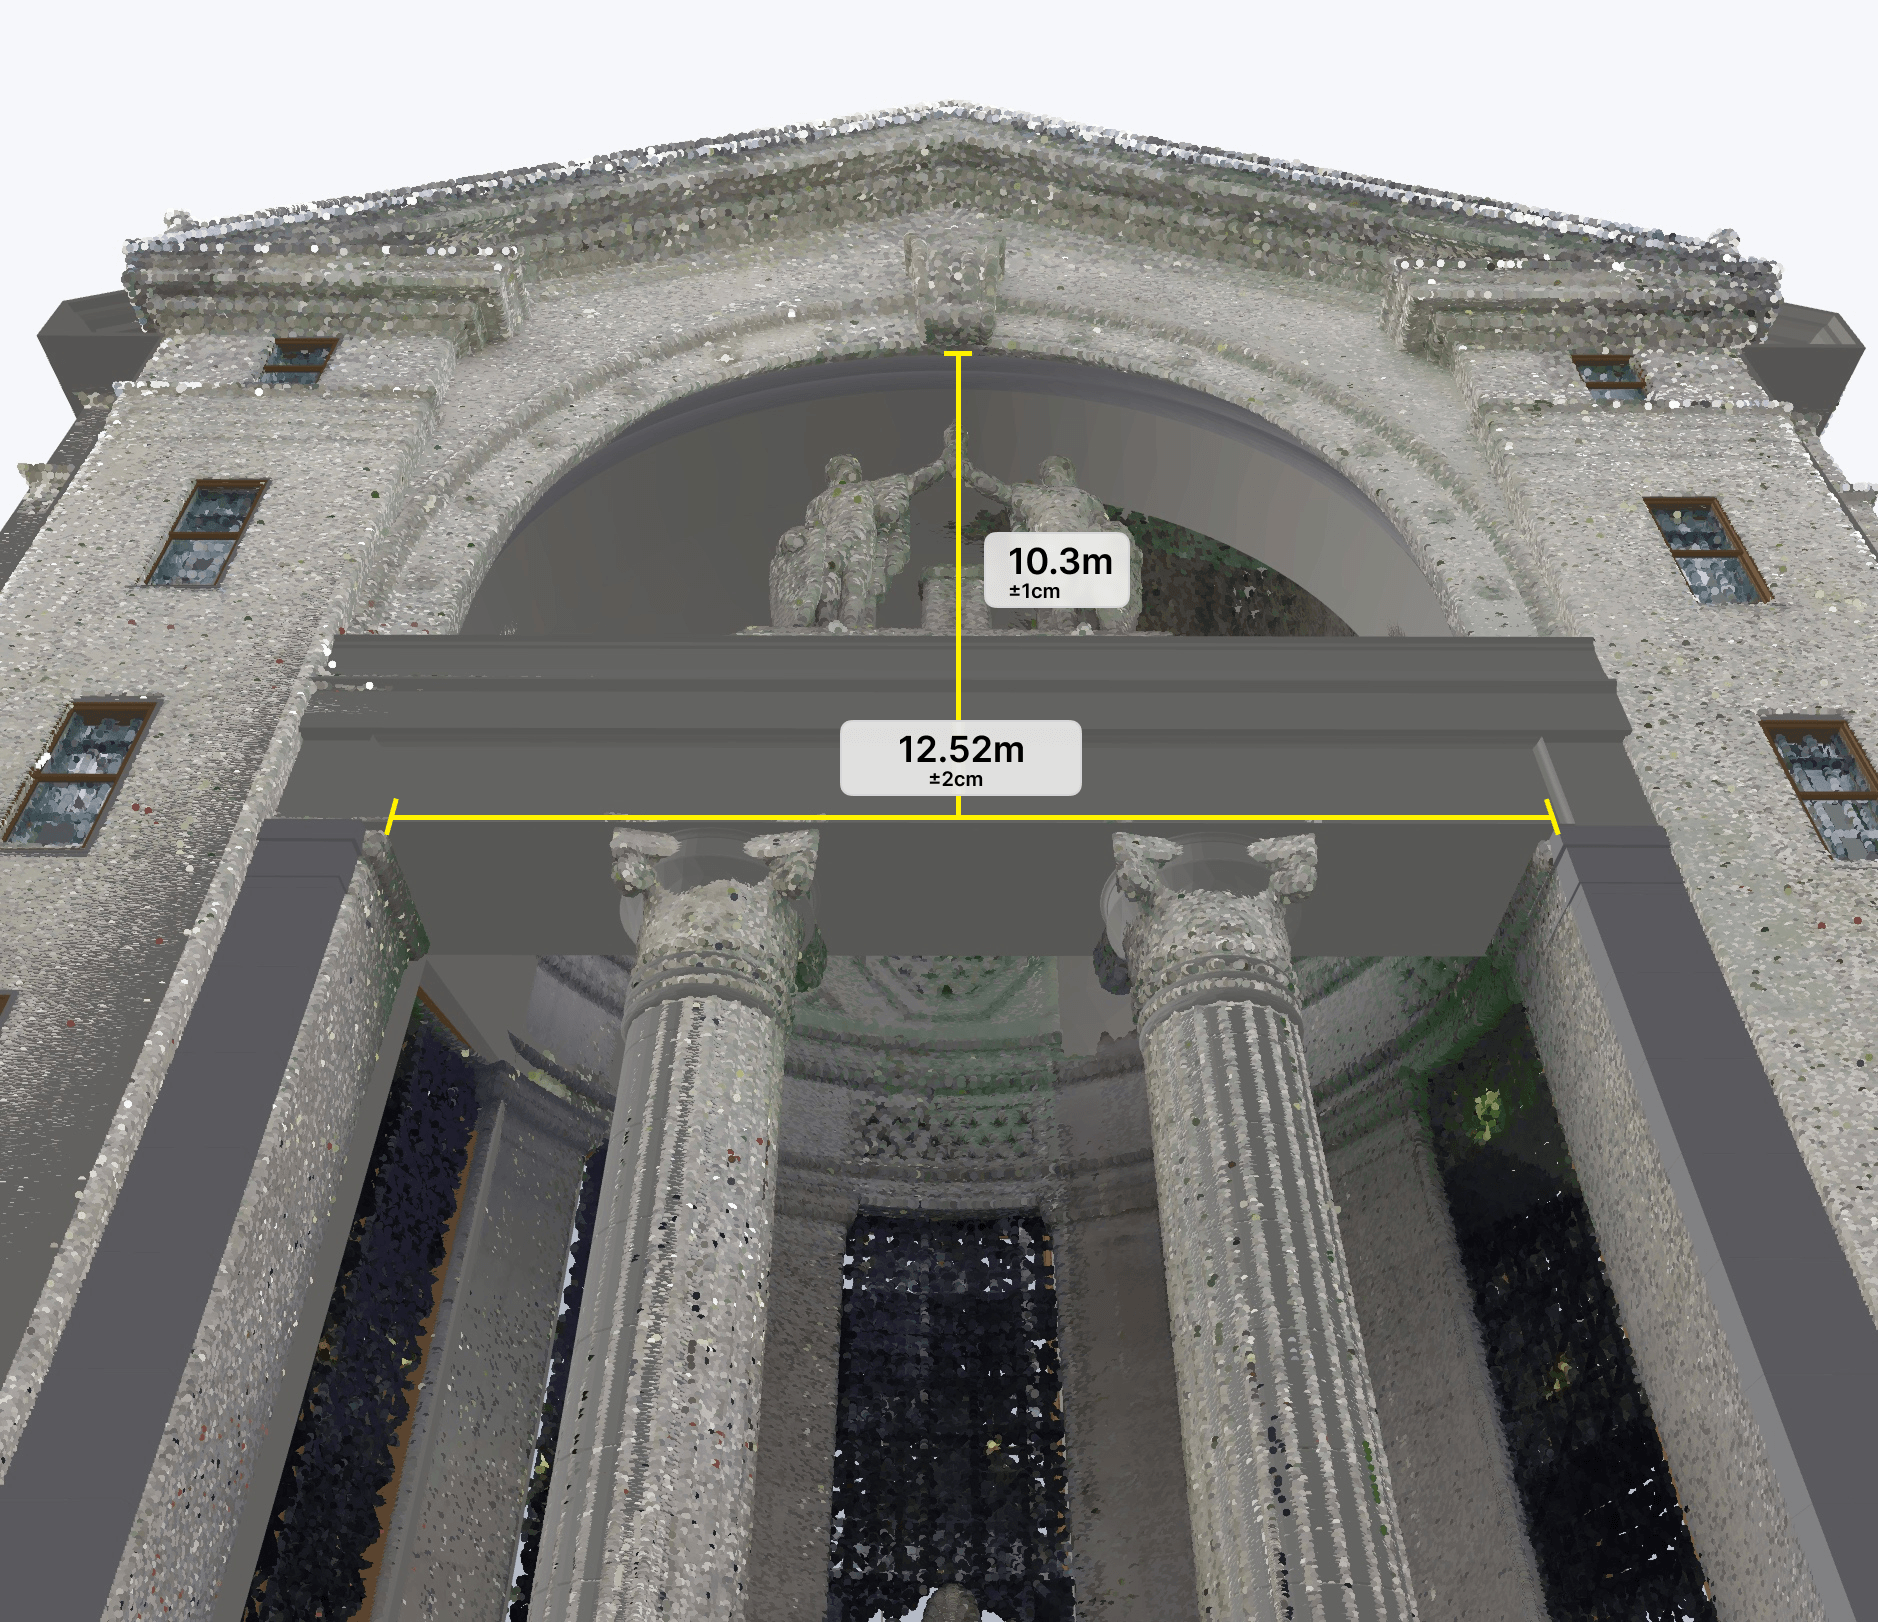
Users can also perform measurements directly within the point cloud, create Points of Interest (POIs), and define custom viewpoints to highlight critical locations or areas requiring further investigation.
Advanced Deviation Analysis with SkyGIS Pro
While SkyGIS Viewer focuses on visualisation and collaboration, SkyGIS Pro provides advanced analytical capabilities for professionals who require detailed deviation analysis.
Point clouds captured through laser scanning can be compared directly with design information, including digital surfaces, LandXML files, IFC models, or user-defined reference planes. This enables accurate calculation of differences between planned and as-built conditions.
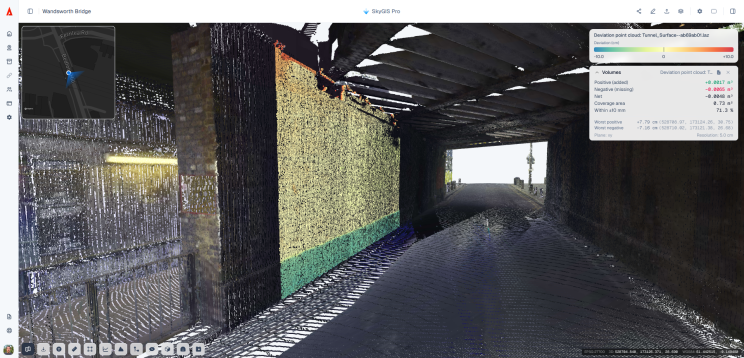
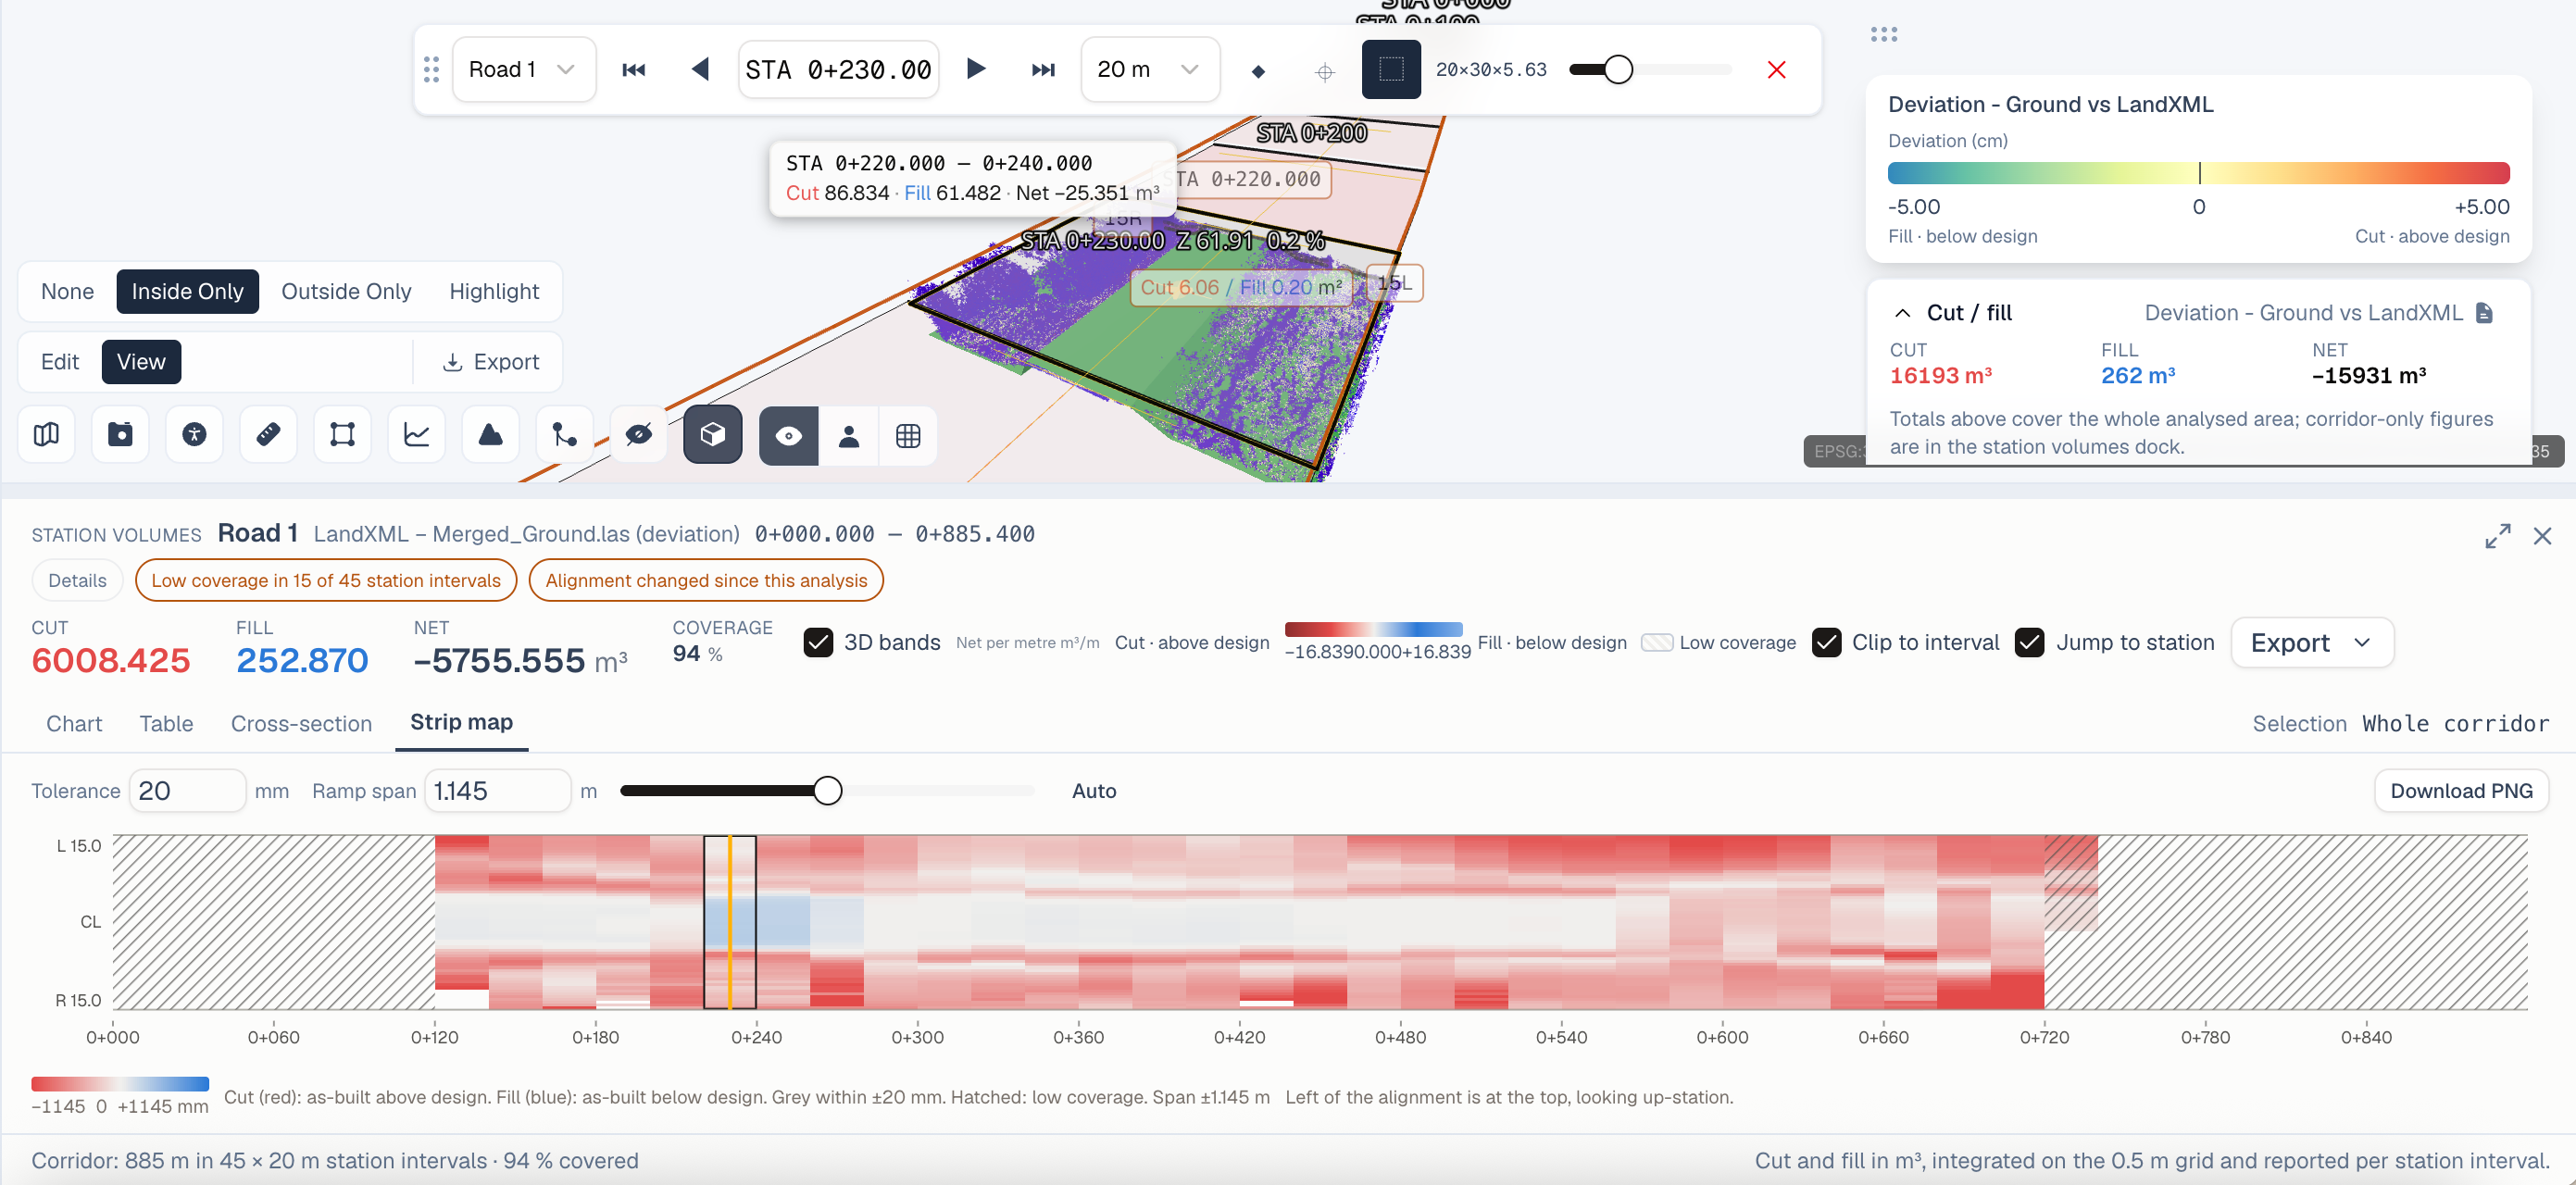
SkyGIS Pro generates detailed deviation point clouds and raster-based deviation maps, providing a clear visual representation of surface variation. These outputs can be exported for further processing in third-party software or retained within the project environment for ongoing monitoring.
Because project data can also be accessed on site through SkyGIS Viewer, deviation results are immediately available to engineers and surveyors during inspections. This supports faster decision-making and reduces the time between data capture, analysis, and corrective action.
Beyond surface deviation analysis, SkyGIS Pro also provides automated cut-and-fill volume calculations relative to selected reference surfaces. Deviation statistics and volume reports can be exported, helping project teams monitor construction progress, quantify material movement, and make informed decisions based on accurate data.
This workflow is particularly valuable for concrete verification, earthworks, and infrastructure projects where continuous quality control is essential. Once a scan has been completed, analysis can be performed within minutes, providing rapid feedback to construction teams and enabling adjustments before issues become costly to resolve.
A Concrete Example
Consider a reinforced concrete column designed to a specific position, height, and geometry. Once the concrete has been poured and cured, a laser scan can capture the actual as-built condition of the column and its surrounding environment.
The resulting point cloud can then be compared directly with the design model or a reference plane. The deviation analysis reveals whether the column has been constructed within the required tolerances and highlights any areas where the as-built geometry differs from the design.
For example, the analysis may show that the column is slightly out of vertical alignment or that parts of its surface extend beyond the specified tolerance. Instead of relying on a small number of manually measured points, the entire scanned surface can be assessed, providing a much more comprehensive picture of the as-built condition.
The results can then form part of the project's quality assurance process, giving engineers and contractors clear, measurable evidence of the actual construction. If deviations exceed the specified tolerance, corrective action can be taken early, before subsequent construction stages make the issue more difficult or costly to resolve.
This example illustrates the value of a modern point cloud-based workflow: the process can move from data capture to analysis and quality assessment in a short, repeatable cycle. Once the scan has been completed, deviation analysis can be performed within minutes, providing rapid feedback to the construction team while there is still time to act.
Choosing the Right Capture Method
The same approach can be applied to a wide range of construction and infrastructure applications, including concrete verification, earthworks, and progress monitoring. Depending on project requirements, data can be captured using Terrestrial Laser Scanning (TLS), Mobile Laser Scanning (MLS), Airborne Laser Scanning (ALS), SLAM-based systems, UAV surveys, or a combination of multiple sources.
As with any surveying workflow, the reliability of the final results depends on the quality of the source data. Accuracy requirements should be defined at the beginning of the project, and the captured data must meet the required project standards.
Ultimately, point clouds provide far more than a collection of measurements. When combined with appropriate analysis methods, they provide a detailed and measurable representation of the as-built environment, allowing project teams to identify deviations earlier, verify construction quality, and make better-informed decisions throughout the project lifecycle.